As some of you might remember, a headless native debugging tool was supported in Node.js for a long time:
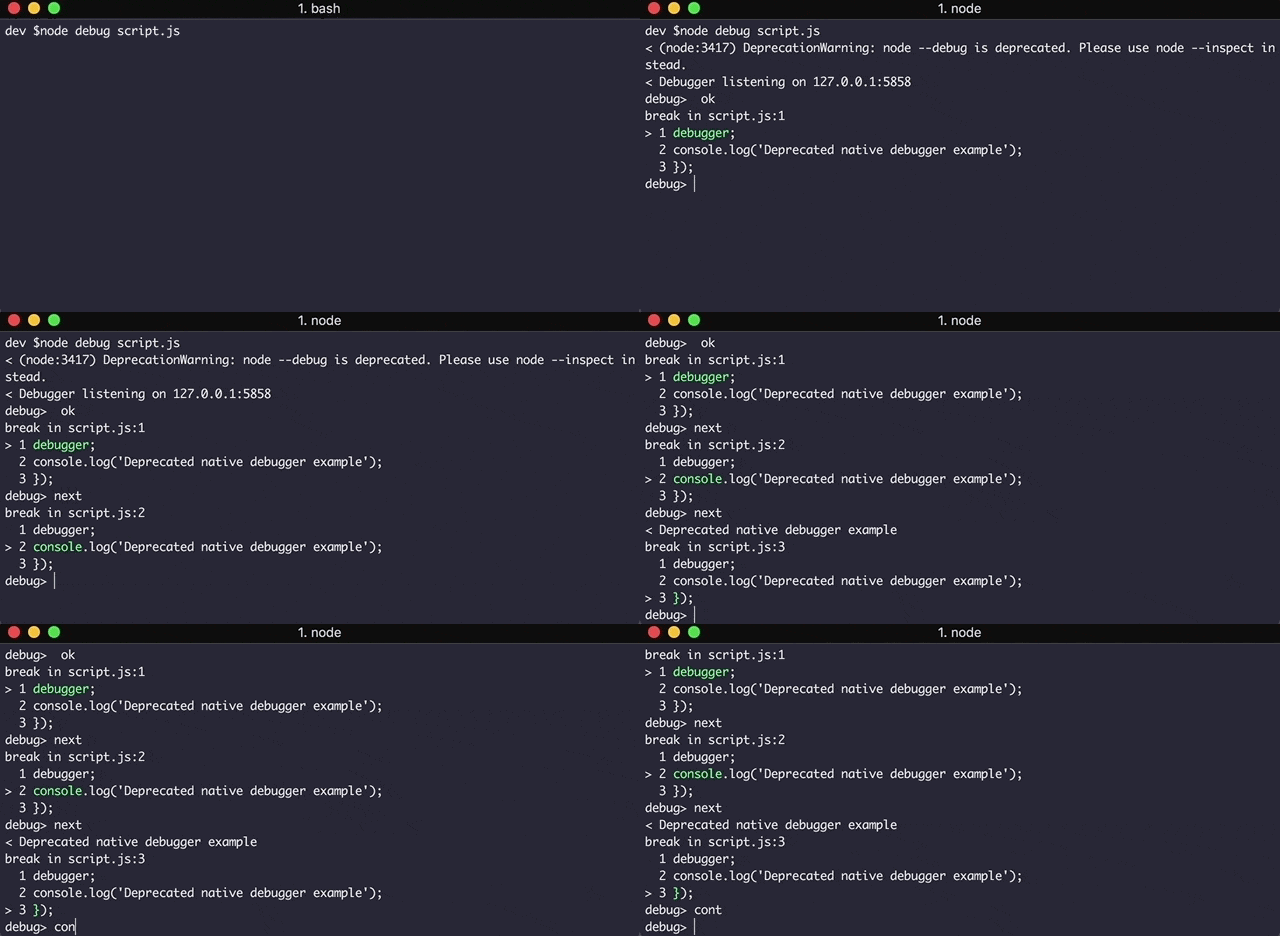
It used a deprecated protocol, which was called V8 debugger protocol. This native tool wasn’t a full-featured debugger, but enabled simple inspections.
Over the years, an improved debugging tool showed up. It was based on the V8 debugger protocol and the developer tools of Blink (the Webkit-based rendering engine of Chromium). This tool enabled us to debug our Node.js application through the DevTools of a WebKit-based browser such as Chrome and Opera! Yes, we’re talking about node-inspector. It was very useful because we could benefit from some DevTools capabilities.
As part of Node.js v6.3.0, a new experimental feature came out – the V8 inspector, which brought a much powerful debugging protocol that integrates with Chrome DevTools and supports up-to-date features like blackboxing, profiling, workspaces, source maps and more. Furthermore, it didn’t depend on the deprecated V8 debugger protocol, rather the Chrome Debugging Protocol. Thus, it could be connected with inspector clients, for instance – a Chromium-based browser, VSCode, WebStorm/IntelliJ. Connecting it to a Chromium-based browser is pretty simple – we just had to navigate to the output URL of the command: node --inspect script.js.
Perhaps you’ve heard that on July 20th – a new tool called ndb was released as an open source project! 🚀
Well, it’s cool there is another way to debug a Node.js application – but what’s the point of an additional debugging tool? 🤔
Motivation
Let’s start by attaching the official definition of ndb:
ndb is an improved debugging experience for Node.js, enabled by Chrome DevTools
From the definition above, we can presume implicitly that:
- ndb improves the debugging experience by providing an easier workflow and exclusive capabilities.
- ndb is based on Chrome DevTools, which means it uses the Chrome Debugging Protocol, similar to the V8 inspector.
- ndb is part of Google Chrome Labs and maintained by the Google Chrome team.
So you might think that ndb just enables extra features compared to the V8 inspector – however that’s not completely the case.
Obviously, the V8 inspector and Chrome DevTools integration assumes that two fundamental things are installed: Node.js v6.3.0+ and a Chromium-based browser. What if we prefer using other browsers on daily basis or just prefer to not install a Chromium-based browser, but still want to be able to debug a Node.js application regardless of our editor?
Well, we haven’t noted anything about the dependencies of ndb yet, so that’s a good time – ndb depends (among other things) on a very popular package, which is called Puppeteer. Puppeteer, for those who aren’t familiar with, is an API for controlling Chromium over the Chrome DevTools Protocol.
When ndb installs Puppeteer, the most recent version of Chromium is downloaded and placed inside node_modules. In addition, the downloaded version is compatible with the host operating system.
So here is an additional benefit – ndb doesn’t depend on a local installed Chromium-based browser (or its version) which belongs to the host machine, because it installs that independently. This makes ndb a browser agnostic debugger, compared to the V8 inspector.
Notice that it increases the size of node_modules thus some of you might find it as a downside.
Alright, let’s start exploring the debugging experience with ndb! 🕵️
Exploring ndb
The first step is to create a basic Express application (an app.js file) which is going to be used for demos:
const express = require('express');
const app = express();

app.get('/', (req, res) => res.send('Hello World!'));

app.listen(3000, () => console.info('Example app listening on port 3000!'));
This project has a single npm script for running the application:
"scripts": {
  "start": "node app.js"
}
Now we’re truly ready to start.
Disclaimer: We’ll go over capabilities which are exclusive to ndb, but non-exclusive as well. If you want to see the exclusive list, check out this paragraph. On top of that, we’re not going to compare the debugging experience of ndb with other inspector clients like VSCode or WebStorm – simply focus on ndb.
How to Install
First up, we should certainly install ndb globally or locally. Installing it globally will standardize a way to debug any Node.js application, regardless the editor or browser that we usually use.
Let’s do that:
npm install -g ndbNote: In case we want to use ndb inside an npm script, it should be installed locally as devDependency.
At this point, we’re able to run the debugger from any Node.js project!
Opening ndb
There are a couple of ways to open ndb – let’s cover them.
1️⃣ – Executing a file directly
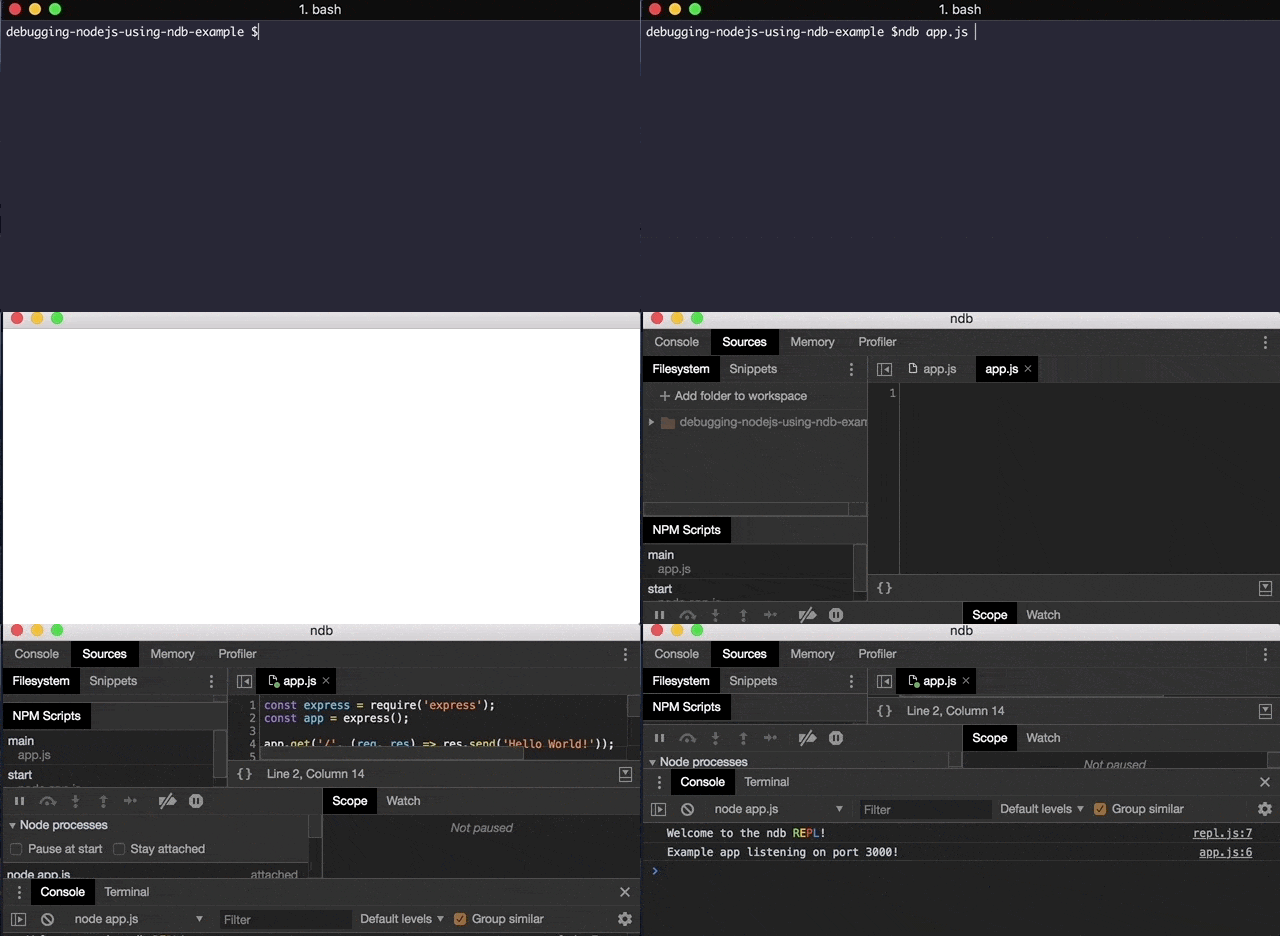
We can open ndb through executing a Node.js script file directly, simply by:
ndb app.jsNotice that we use ndb instead of node.
2️⃣ – Executing an installed binary
Sometimes we want to debug a script of our application using a globally or locally installed package, which brings its executable binary file with itself – such as npm scripts, task runner, test runner and so on.
It’s possible easily by attaching ndb before:
ndb npm startIn the above command, we use the global npm to run an npm script right into ndb. Theoretically, we could run ndb webpack or ndb mocha either assuming we have the appropriate configuration for them in our project.
Note: In order to run an executable binary file of a locally installed package, we must use ndb with npx, just like: ndb npx mocha.

3️⃣ – Opening a project
It’s not necessary to execute a file or an executable binary just for opening ndb – we could do it explicitly within the project’s directory, by:
ndb .This command gives us a freedom to perform stuff before executing a script – like placing breakpoints, editing the files or anything else.

From this point on, we’ll assume that ndb is opened using the third way and that the application runs in the background.
Placing Breakpoints
Placing breakpoints while we debug is quite straightforward. All we’ve to do is applying them on the relevant code:
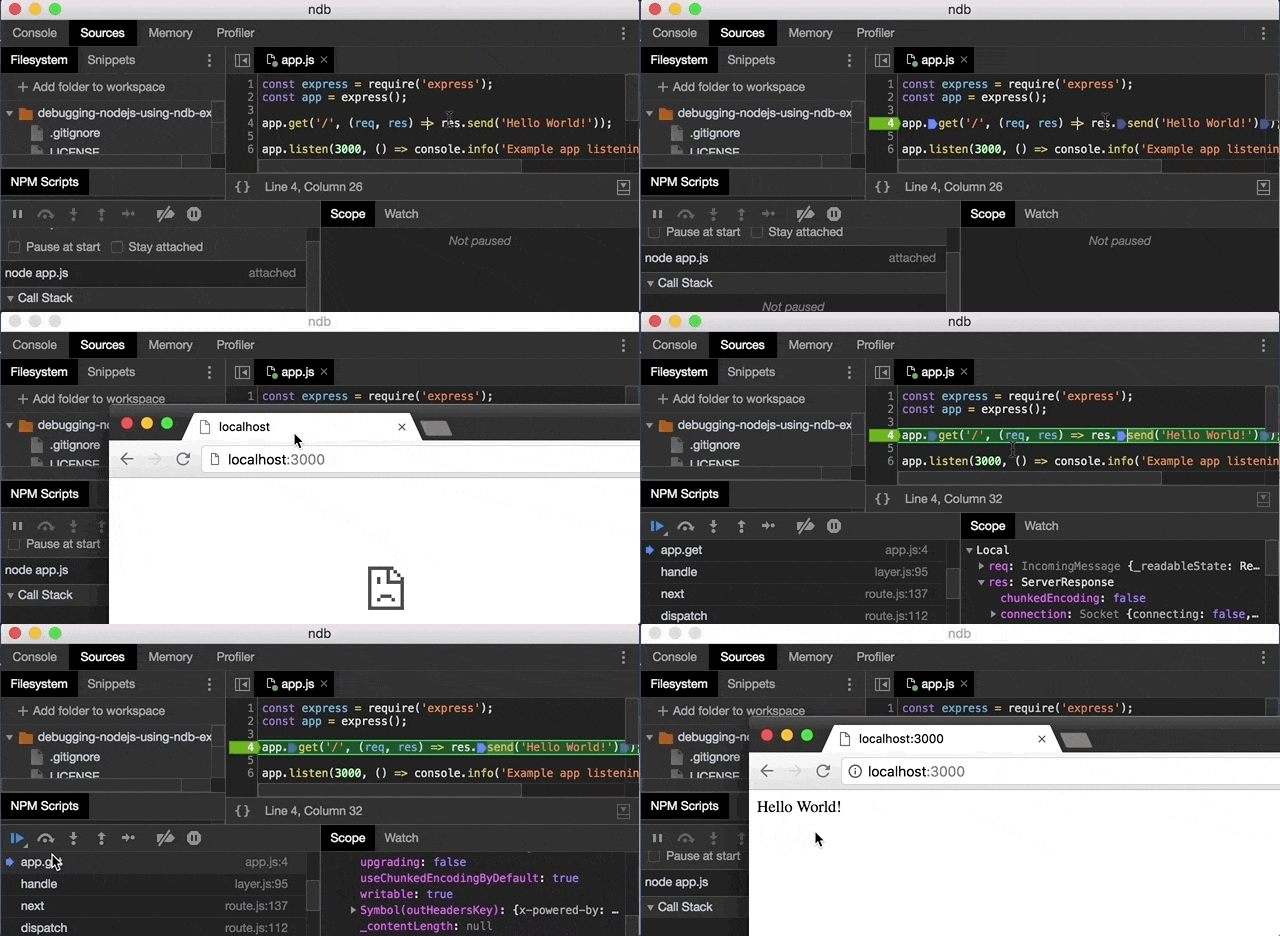
Notice that we can place breakpoints before the modules are actually required!
Working with Files
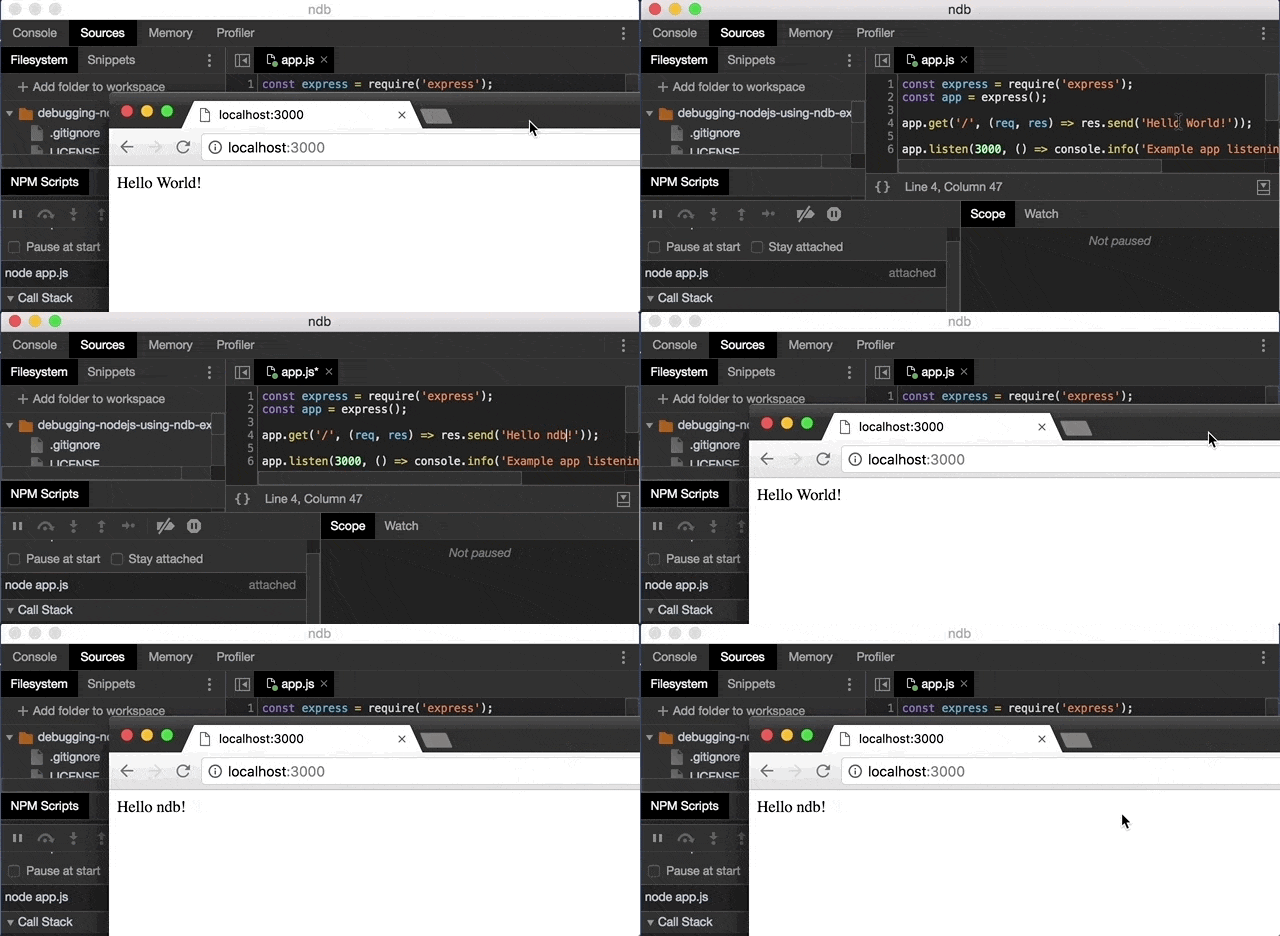
With Workspaces of Chrome DevTools, we can create and edit files within the project and save them to the local file system:
Running npm Scripts
If the project contains some npm scripts, these are available through ndb inside a dedicated pane:
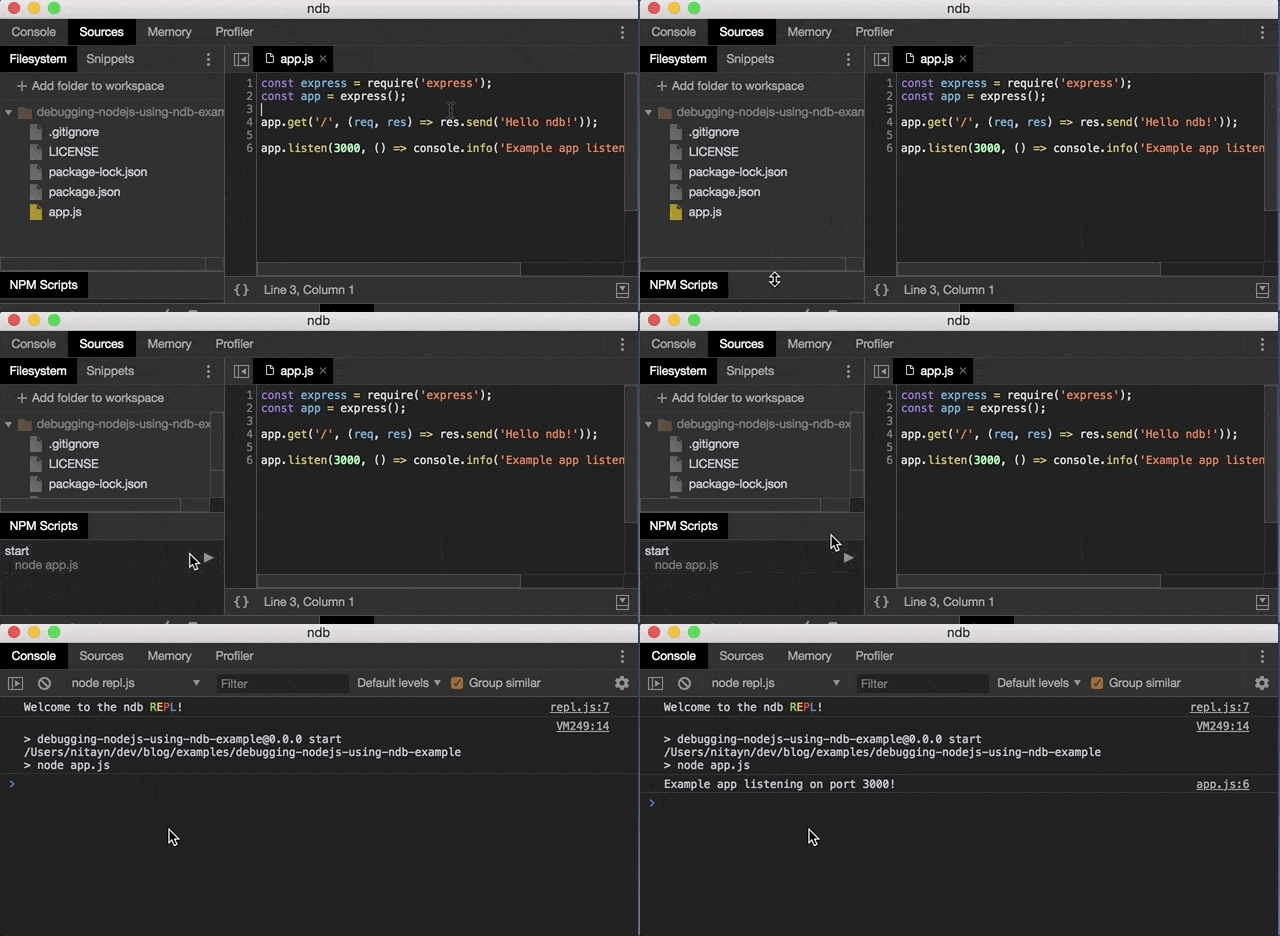
Pay attention – the application which had been run in the background was terminated for the demo above.
Built-in Terminal
The experimental terminal which was added to Chrome DevTools is accessible through ndb either:
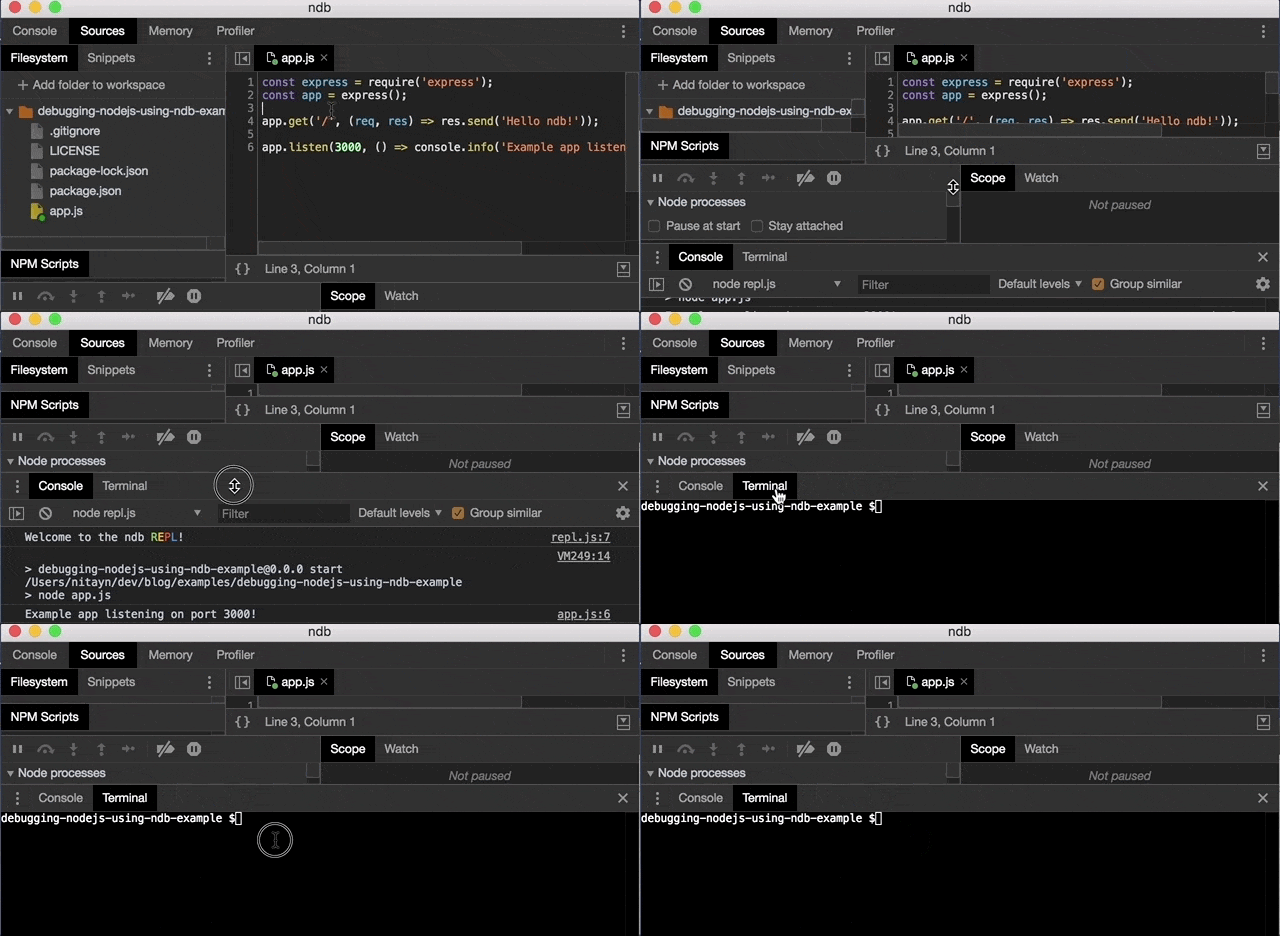
As you probably guess, it uses the local terminal environment settings of the host machine.
Blackboxing
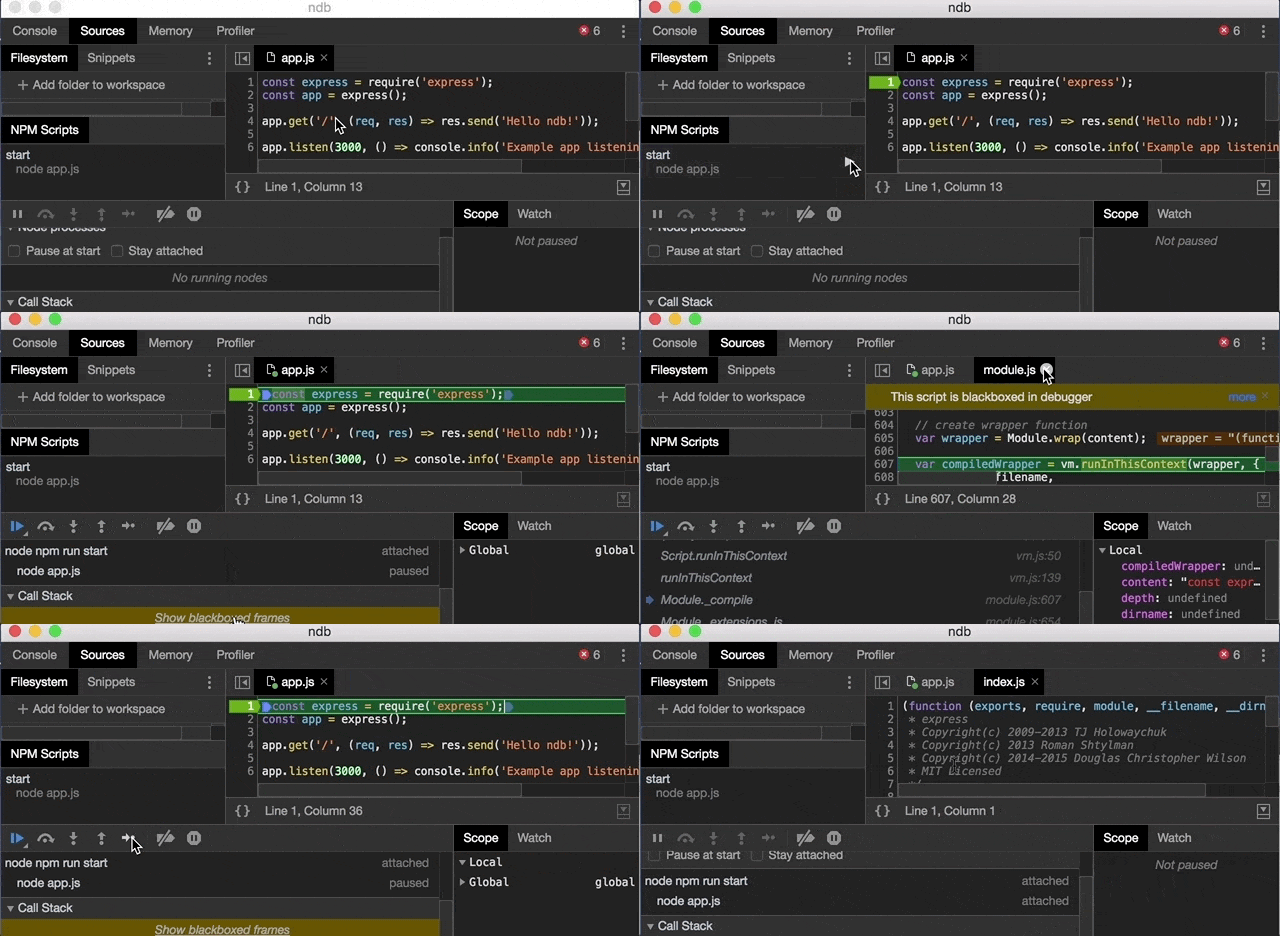
By default, ndb blackboxes external sources, like node internal libraries, which aren’t really interesting while we debug our project:
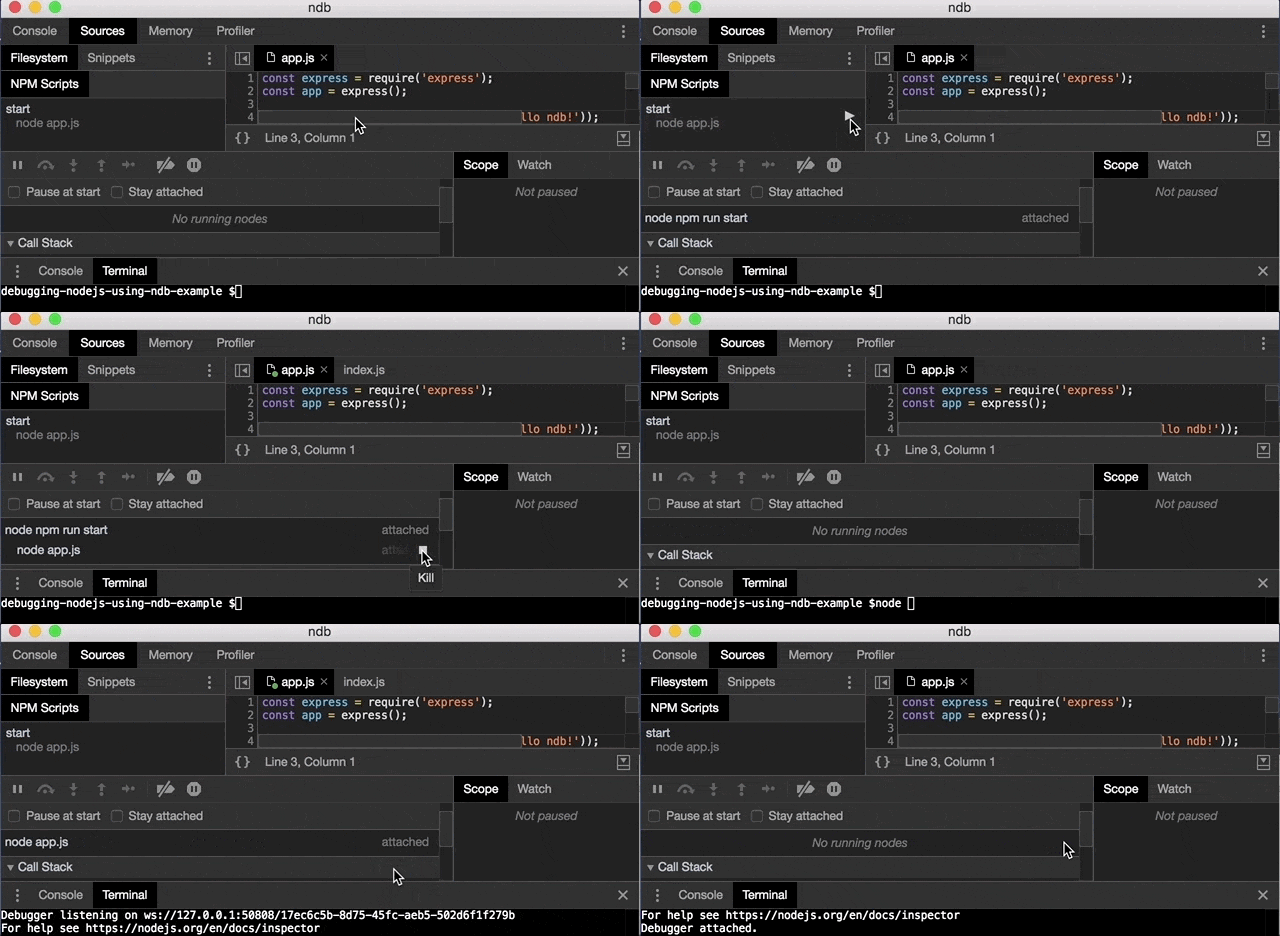
Processes Pane
This is a pane which lists the current running Node.js processes by ndb. Moreover, a child process is attached automatically to its parent process – so it’s absolutely plain to follow and even terminate both:
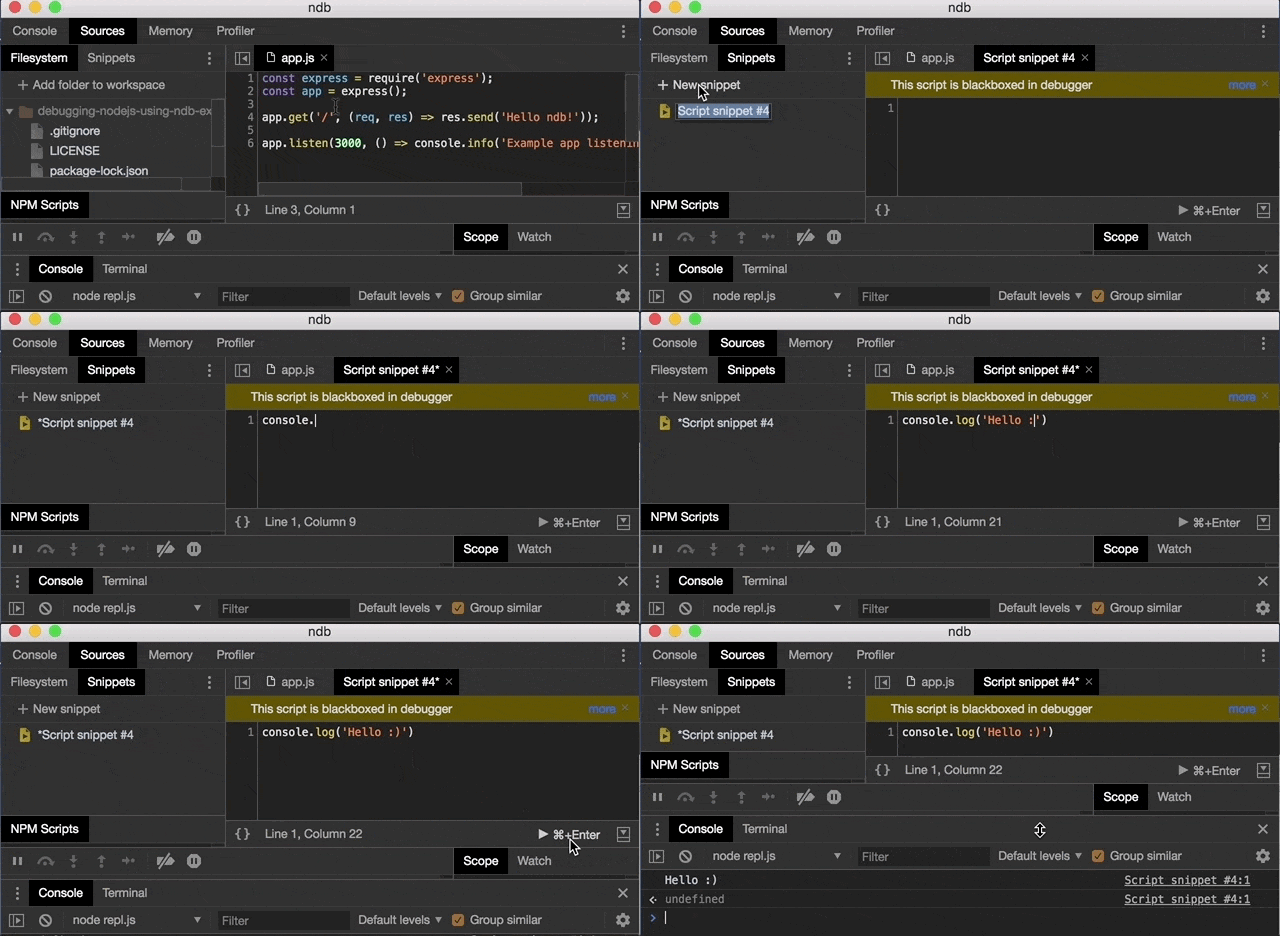
Snippets
Snippets are little scripts that we can create, execute and debug immediately through Chrome DevTools and these are supported also in ndb:
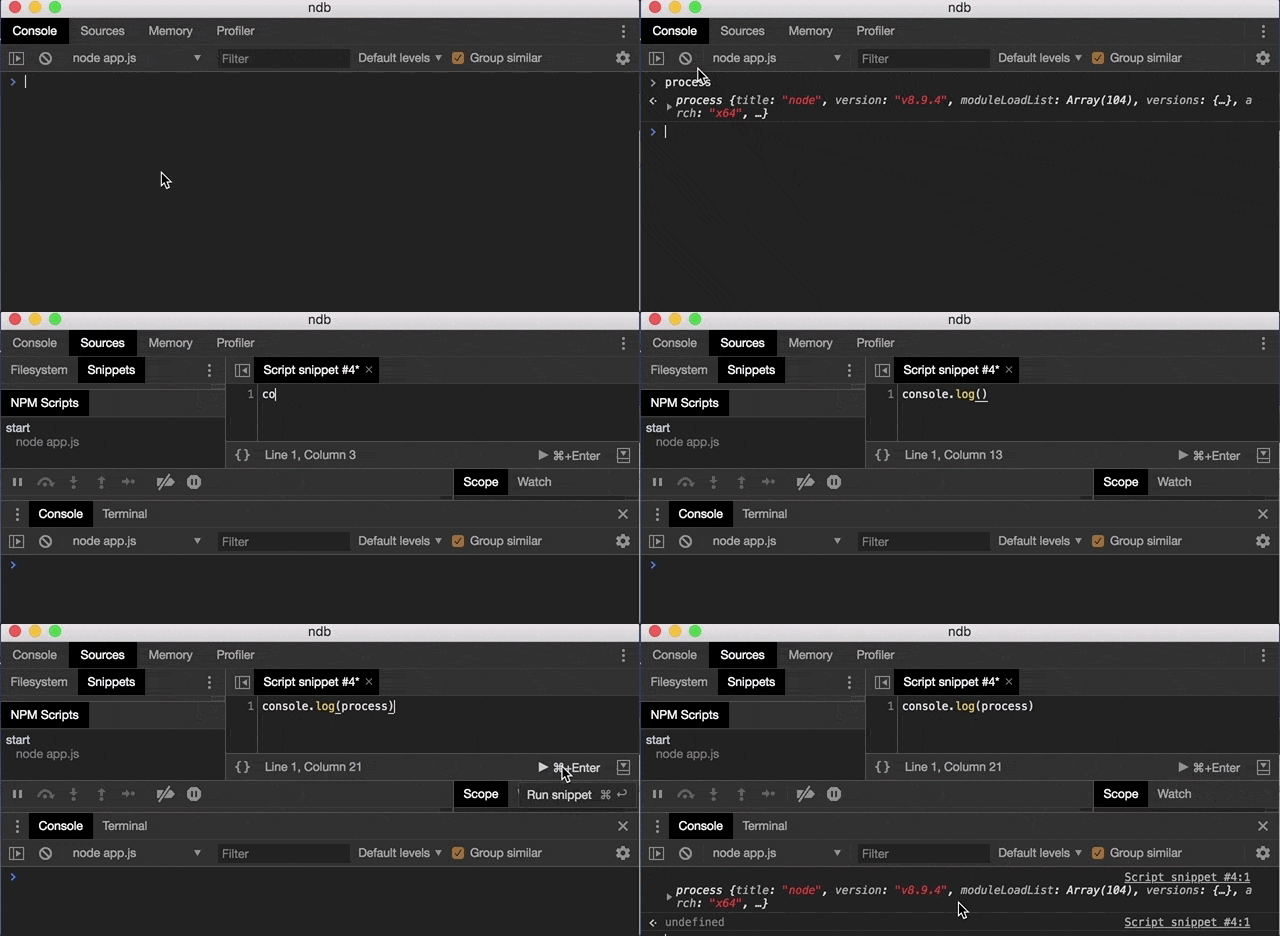
Process Object
Of course that Process, the global object of Node.js, is accessible in ndb’s Console:
process object to ConsoleSummary
We focused today on the debugging experience for a Node.js application with ndb.
Here are several important points:
- The V8 debugger protocol (the old native debugger) is deprecated.
- The node-inspector debugger is deprecated.
- Node.js v6.3.0 arrived with the V8 inspector which is based on Chrome Debugging Protocol.
- The V8 inspector could integrate with various inspector clients such as a Chromium-based browser, IDEs/editors and other clients.
- The integration between V8 inspector and Chromium-based browser provides us up-to-date DevTools capabilities, assuming that such browser is installed locally.
- ndb became an open source project on July 20th.
- ndb has some exclusive capabilities, beside the supported up-to-date DevTools capabilities.
- ndb uses the Chrome Debugging Protocol, much like the V8 inspector.
- ndb is maintained by the Google Chrome team.
- ndb depends on Puppeteer, which downloads a local version of Chromium into
node_modules. - Thanks to Puppeteer, ndb is a browser agnostic debugger.
- Using ndb, we’re able to debug any Node.js application regardless the browser or editor we use.
- ndb should be installed as devDependency in case we want to use it inside an npm script.
- There are three different ways to open ndb.